Dev toolbar
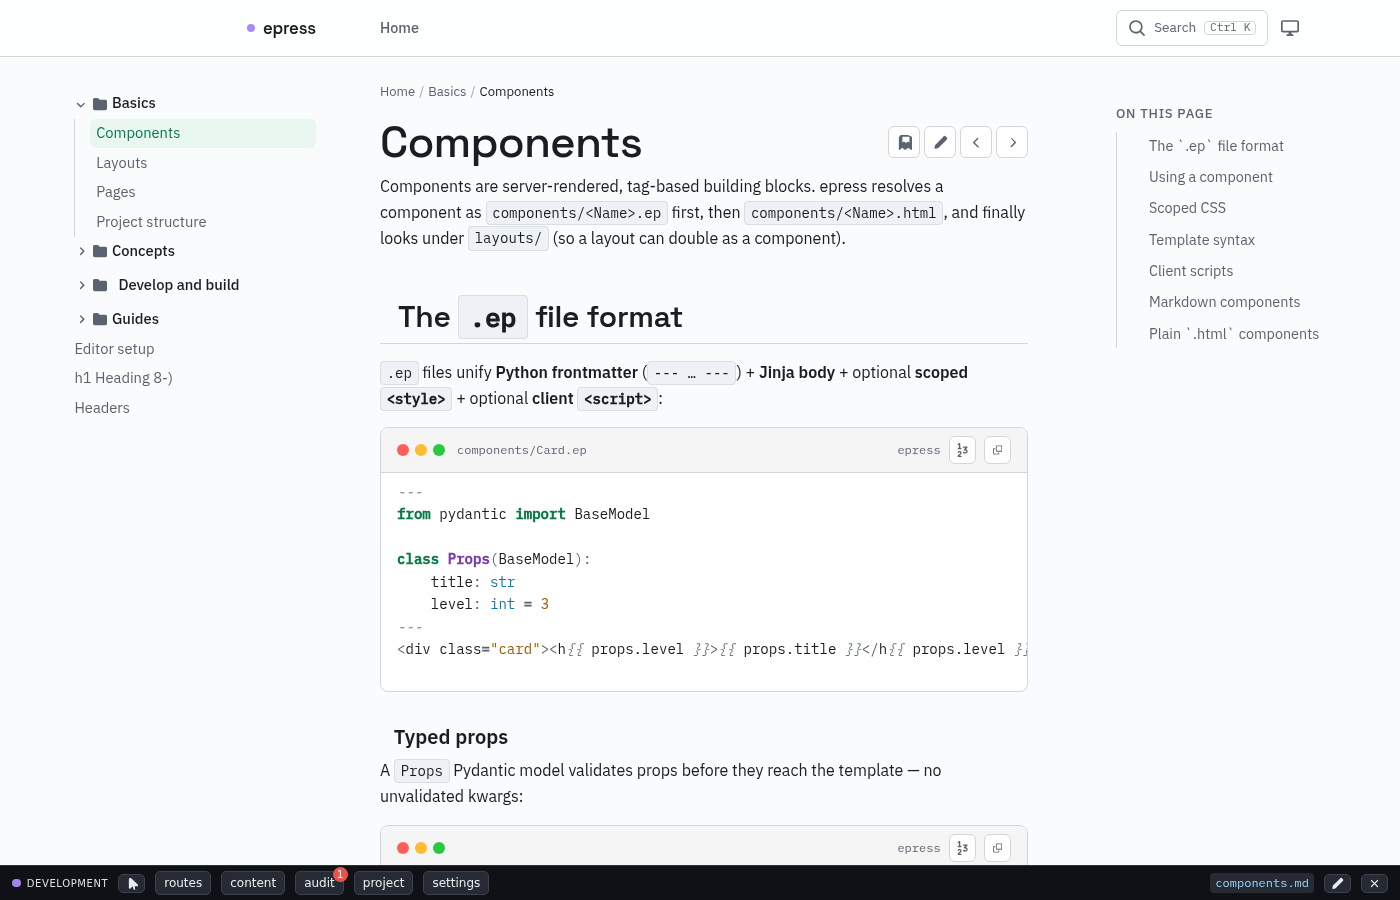
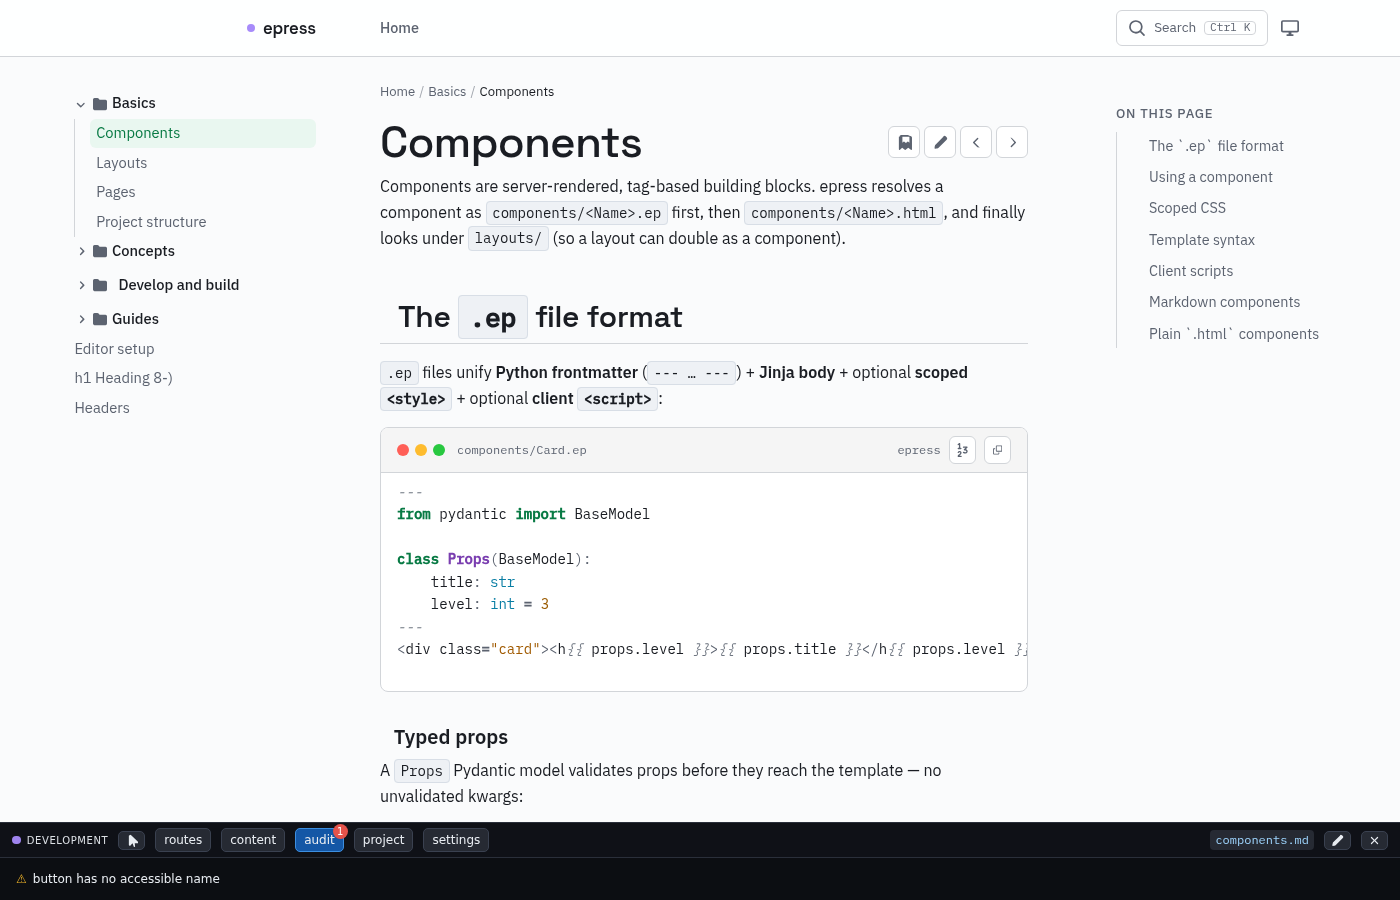
A small, theme-agnostic toolbar helps you inspect the site while you work. It appears at the bottom of every page (placement is configurable) whenever the server injects it:
epresso dev— the development server (with live-reload).epresso preview/epresso docs— a builtdist/served back; the toolbar is injected at serve time, with live-reload/WebSocket disabled.
It is never written into epresso build output — the files on disk in
dist/ stay clean, and a plain static host (no epresso server) never shows it.
Environment chip
The toolbar's left edge shows the active environment as a coloured dot + name, so you always know which build you're looking at:
| env | dot | notes |
|---|---|---|
development | purple | epresso dev |
preview | orange | epresso preview --env preview |
production | site accent | plain epresso preview (a production-like build) |
The docs theme also tints its nav brand dot to match, via a core-injected
CSS variable --epresso-env-dot — e.g. var(--epresso-env-dot, var(--accent)).
On the deployed production site (no injection) it falls back to the normal
accent. Other themes can opt into the same hint without any core change.
Inspect
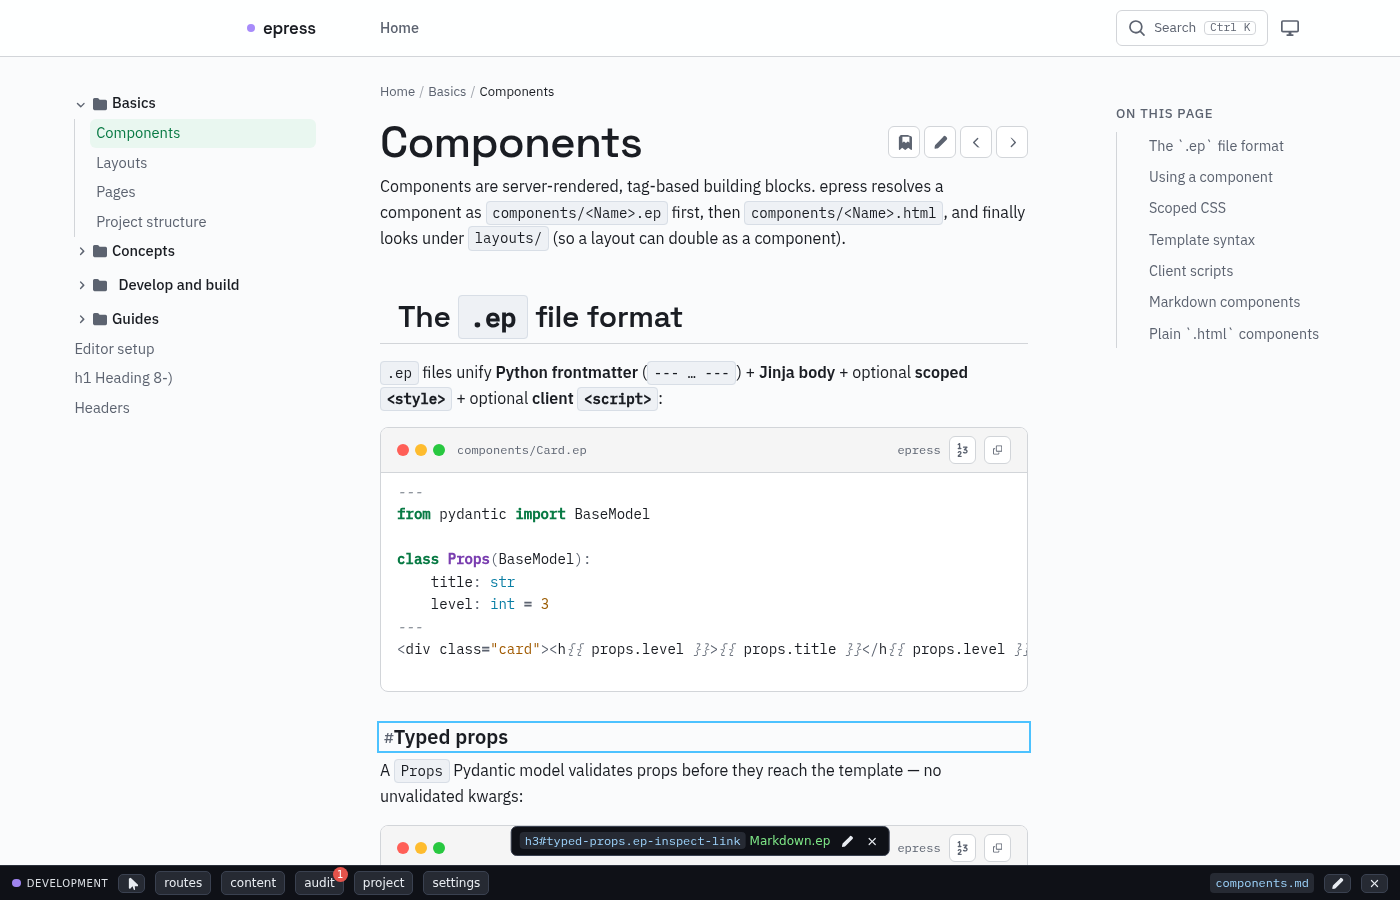
Click inspect to enter pick mode. Hover an element to highlight it and show
a popup with its tag, #id/.classes, and the component source that produced
it. Click the element to pin it (the popup stays, and the highlight is kept);
click the little open button to jump to that source in your editor.
Routes
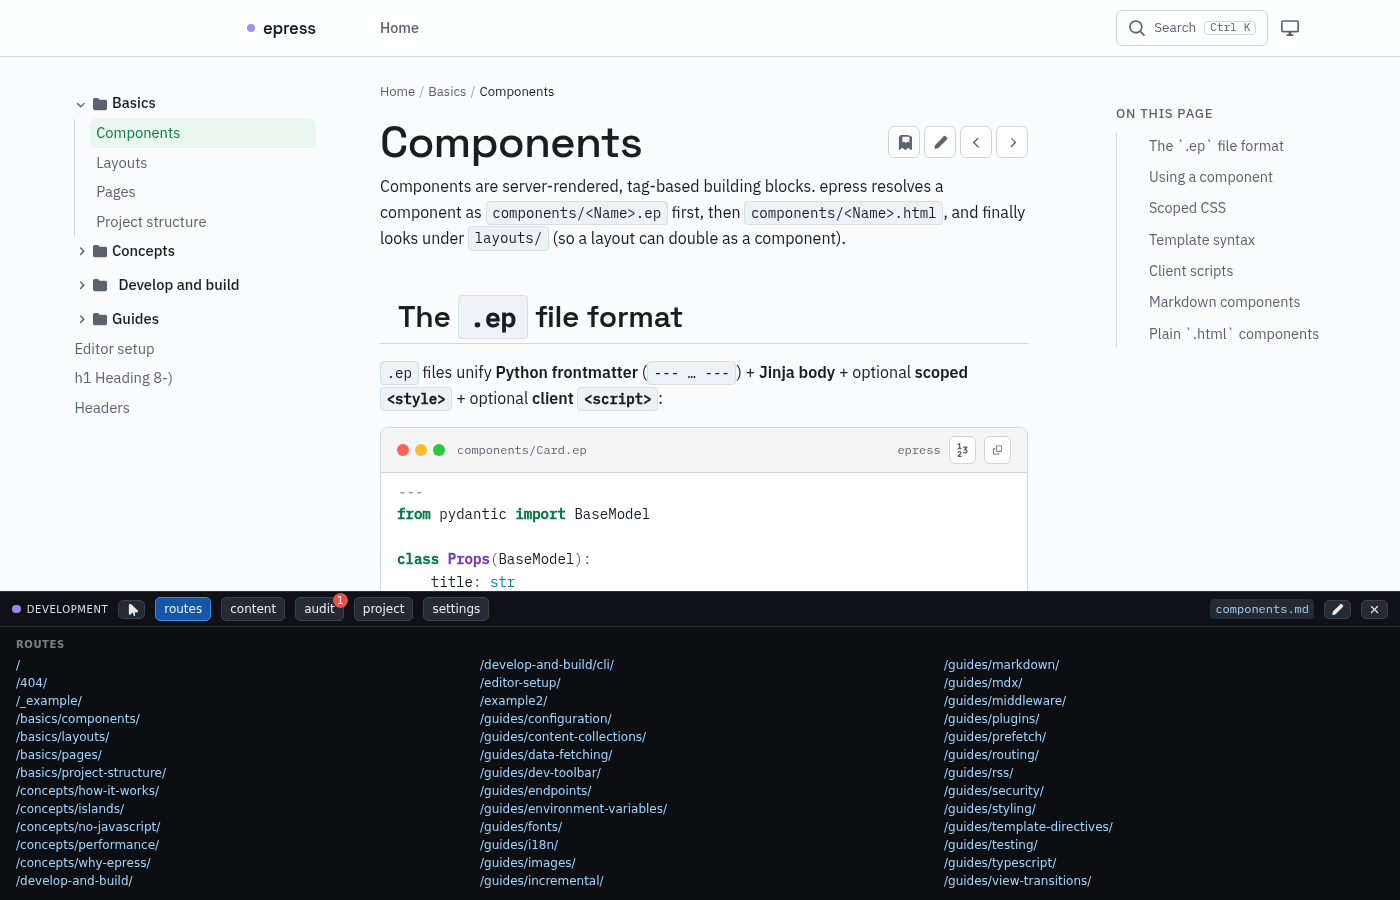
Lists every HTML route on the site as a link. Click any route to go straight to it.
Content
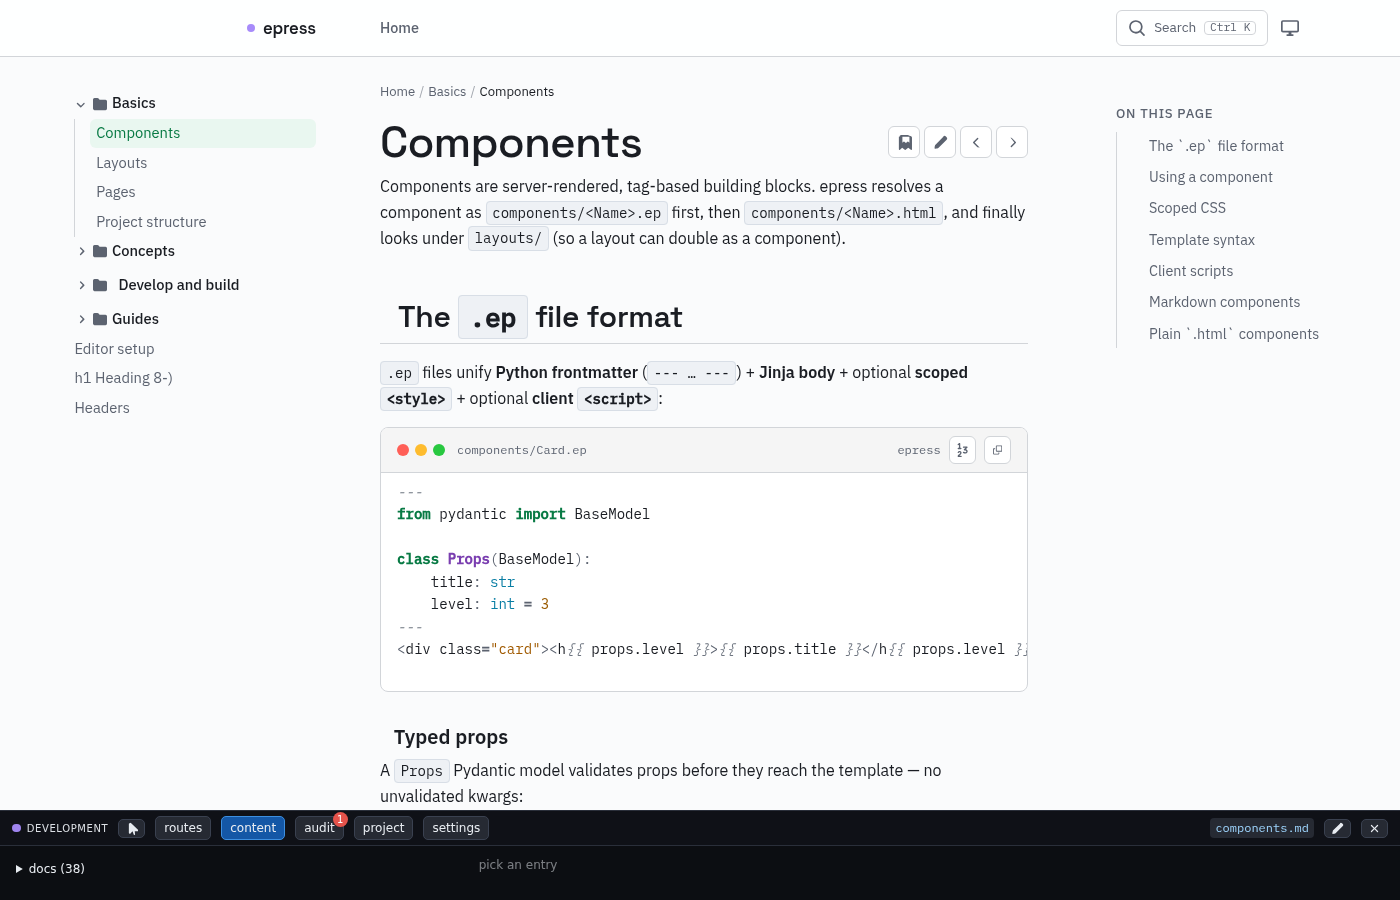
A two-column explorer over the site's content collections. The left pane is a
tree of collections → entries; click an entry to inspect its validated front
matter data and rendered body on the right.
Audit
Runs a handful of static, on-page checks — missing lang, missing viewport,
img without alt, links with empty/# hrefs or no text, duplicate ids, and
buttons with no accessible name. A red badge shows the issue count; click a
result to highlight and scroll to the element.
Project
Shows the epresso version, a link to the configured repository, and a copy debug info button (version, root, environment, collections, route count) — handy for bug reports.
Settings
Preferences persist in localStorage:
- placement — dock the toolbar at the
bottom(default) ortop. - notifications — show/hide toast messages.
- verbose — debug logging to the console.
- editor — scheme used by the inspect open button (
vscodeornvim).
Draft & private pages
If the current page is marked draft or private, a status pill appears at the
bottom-right so you know it won't be in the production build. A small toast
also announces dev-server rebuilds (and error toasts on failures).
Keyboard shortcuts
Two shortcuts drive the toolbar, and since the toolbar only ever appears when an epresso server serves the page (see above), they exist in development only — a production build has neither the shortcuts nor the handler:
| keys | action |
|---|---|
Shift+Alt+D | show/hide the toolbar |
Shift+Alt+I | toggle inspect mode (hover to highlight, click to pin) |
Shift+Alt rather than Ctrl/⌘+Shift keeps clear of browser-reserved
combos (Ctrl+Shift+D bookmarks all tabs, Ctrl+Shift+I/Ctrl+Shift+C open
the browser's own devtools). The keys are matched on the physical key (e.code),
so they work on non-QWERTY layouts too, and never fire while you're typing in an
input. Both are also listed in settings.
Colour scheme
The site follows the OS preference. This button emulates the other one while you
work: it cycles system → dark → light (monitor, moon, sun), remembers the
choice in the toolbar's localStorage prefs, and applies it by setting
data-theme-emulated on <html> — the theme keeps owning data-theme, so
system hands control straight back to the OS.
Configuration
[dev.toolbar] in site.toml:
toml[dev.toolbar]enabled = true # show the toolbar whenever an epresso server serves a pageplacement = "bottom" # "bottom" (default) or "top"
Set enabled = false to turn it off.